Feature Analysis
This tutorial covers how to analyze and visualize the features learned by your sparse autoencoder. Understanding what features represent is crucial for mechanistic interpretability.
Overview
DeepLens provides several utilities for feature analysis:
| Function | Description |
|---|---|
generate_feature_heatmap |
Visualize logit distributions across positions |
plot_topk_distribution |
Bar chart of top-k token predictions |
get_top_k_tokens |
Extract top predicted tokens at each position |
Basic Analysis Workflow
After training an SAE, the typical analysis workflow is:
- Extract activations from a sample text
- Encode through the SAE to get feature activations
- Identify which features are active
- Investigate what those features represent
from deeplens.extractor import ExtractSingleSample
from deeplens.intervene import InterveneFeatures

# Extract activations
extractor = ExtractSingleSample(hf_model="gpt2", layer=3)
text = "The capital of France is Paris."
activations = extractor.get_mlp_acts(text)

# Load SAE and get feature activations
intervene = InterveneFeatures(
    sae_model="models/best_model.pt",
    sae_config="config.yaml"
)

# Find active features at last token
active_features = intervene.get_alive_features(activations, token_position=-1)
print(f"Active features: {active_features[:10]}")
Finding Active Features
Get All Non-Zero Features
# Get indices of all active features at the last token
active_features = intervene.get_alive_features(
    activations,
    token_position=-1  # -1 for last token
)

print(f"Number of active features: {len(active_features)}")
print(f"Feature indices: {active_features.tolist()}")
Get Top-K Most Active Features
# Get only the top 20 most active features
top_features = intervene.get_alive_features(
    activations,
    token_position=-1,
    k=20  # Only return top 20
)

print(f"Top 20 features: {top_features.tolist()}")
Visualizing Logits
Heatmap
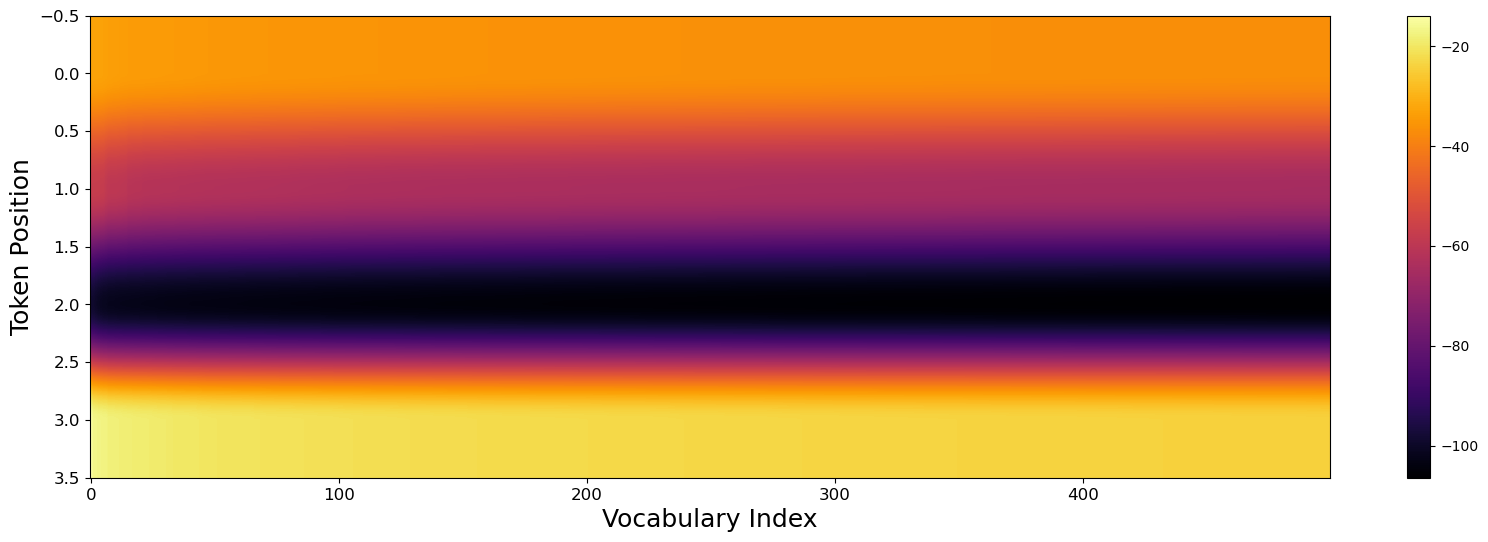
Generate a heatmap showing how logits distribute across the vocabulary:
from deeplens.utils.analysis import AnalysisUtils
from deeplens.intervene import ReinjectSingleSample

# Get logits from the model
reinject = ReinjectSingleSample(hf_model="gpt2")
analysis = AnalysisUtils(
    hf_model="gpt2",
    sae_model="MODEL/DIR",
    sae_config="CONFIG/DIR",
    layer=3
)

# First, get modified activations (or original ones)
_, original_acts, modified_acts = intervene.intervene_feature(
    activations=activations,
    feature=active_features[0].item(),
    alpha=1.0  # No modification, just decode
)

# Get logits
logits = reinject.reinject_and_generate(
    text=text,
    modified_activations=original_acts,
    layer=3,
    generate=False
)

# Generate heatmap
analysis.generate_feature_heatmap(logits, k=1000, save_name="logits_heatmap")
The heatmap shows: - X-axis: Vocabulary indices - Y-axis: Token positions - Color: Logit magnitude (brighter = higher)
Top-K Token Distribution
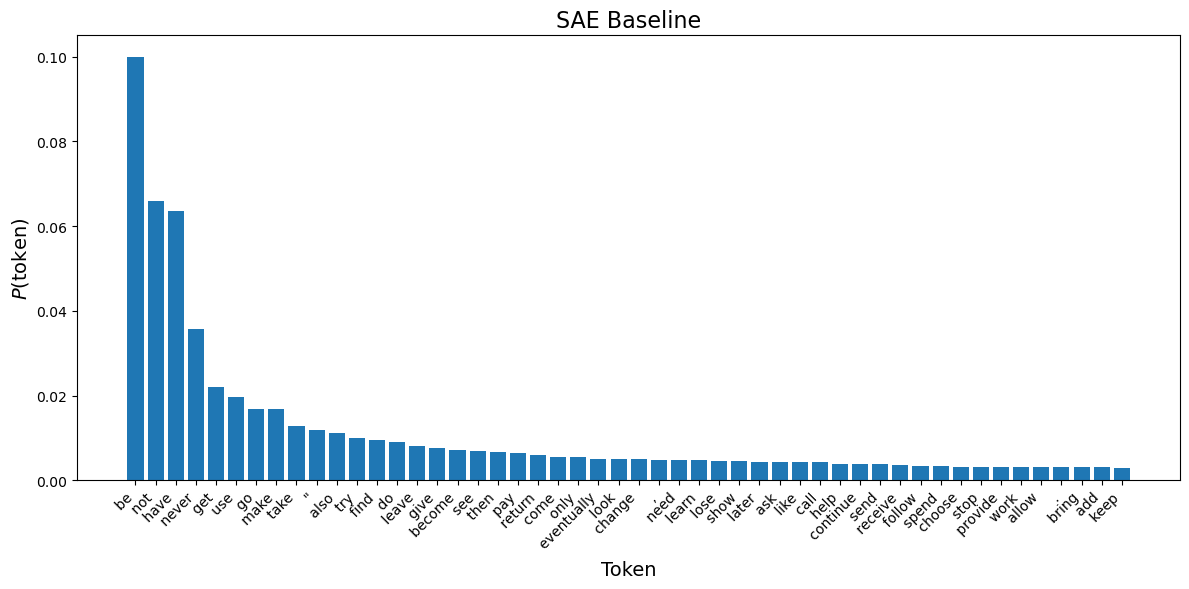
Visualize the most likely next tokens at a specific position:
analysis.plot_topk_distribution(
        logits=logits,
        use_softmax=True,
        k=50,
        position=-1,
        title="SAE Logits"
    )
Parameters:
- k: Number of top tokens to show
- position: Which token position to analyze (use -1 for last)
- use_softmax: Convert logits to probabilities
- title: Plot title
- save_name: Filename to save (without extension)
Extract Top Tokens as Data
results = analysis.get_top_k_tokens(
    logits=modified_output,
    k=5,
    to_dataframe=True,
    verbose=False
)
Troubleshooting
Empty Active Features
If get_alive_features returns an empty tensor:
- Check that your SAE is trained properly
- Try a different token position
- Verify activations are not all zeros